TP Reporting
Estimation-based Progress, Resolved Issue Count, Failed Ratio...
![]() Important aggregation details can be shown by two custom field types Sum SubTasks CF Number Value and Progress CF Based on Number CF. Here are few examples what can be shown:
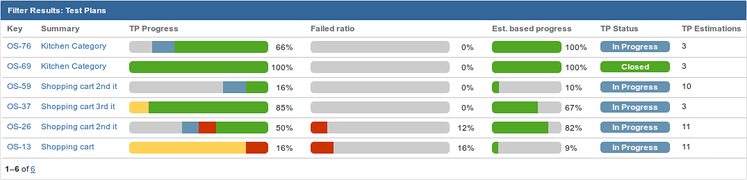
Important aggregation details can be shown by two custom field types Sum SubTasks CF Number Value and Progress CF Based on Number CF. Here are few examples what can be shown:
| Field | Description |
|---|---|
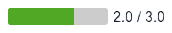
| Estimation based progress | Percentage
Estimations are taken from TC under given TP. |
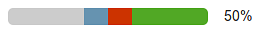
| Resolved issues count | Percentage
Tested TCs are counted and compared with all TCs under given TP. |
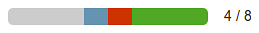
| Failed ratio |
How many TCs have failed in given TP. (To make only two colors on bar create dedicated Color Status that will map only Fail status to red color. You don't have to show it on screen, just use it in Progress CF Based on Number CF configuration.) |


![]() Note that all those fields you can put on Panel or gadgets. Here is 'Filte Result' gadget from manager dashboard:
Note that all those fields you can put on Panel or gadgets. Here is 'Filte Result' gadget from manager dashboard:
Estimations
![]() It is difficult to estimate whole Test Plan from top. However, each Test Case under plan may have estimations that can be sum on TP.
It is difficult to estimate whole Test Plan from top. However, each Test Case under plan may have estimations that can be sum on TP.
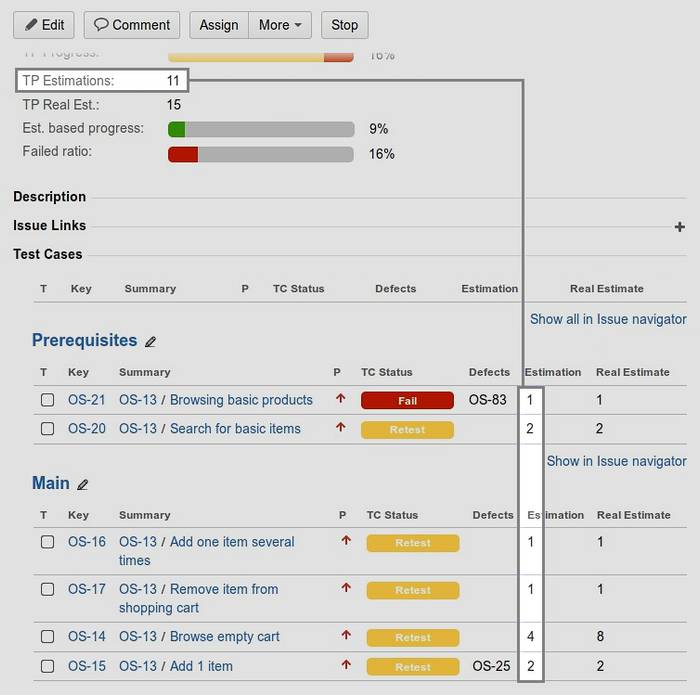
Examples of field created with Sum SubTasks CF Number Value:
| Field | Description |
|---|---|
| TP Estimation | Test Case contains Estimation number field that is sum on TP. |
| TP Real Est. | Test Case contains Real Estimation field (Real Estimated TC Workload) that calculates estimated TC execution time considering retests. Sum of Real Estimation can be shown on TP to see how extra work was or will be taken to complete TP. |
| Retests Overall | Test Plan contains Retest Count number field (used for example in Real Estimated TC Workload ). This number from all TCs can be shown on TP to measure how smooth plan was executed. |
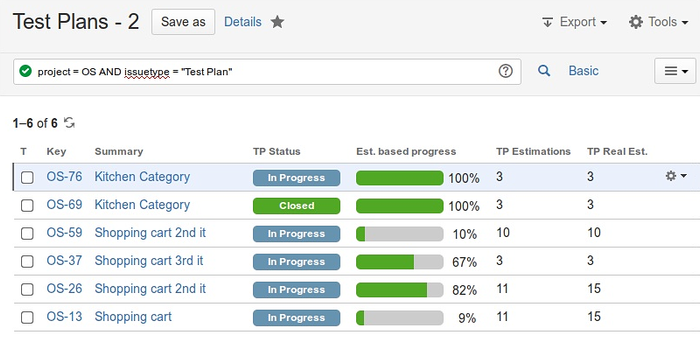
![]() It is possible to create filter or gadget to show those sums for many TPs.
It is possible to create filter or gadget to show those sums for many TPs.
Test Plan Status
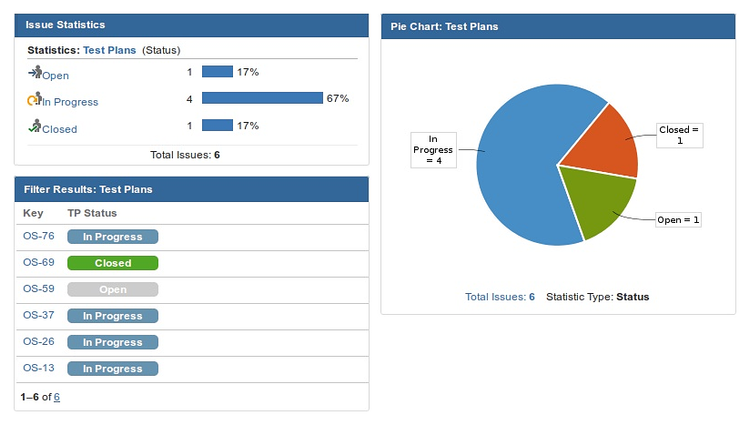
![]() Show test plan statuses on dashboard using several gadgets:
Show test plan statuses on dashboard using several gadgets:
Assignee and Other Statistics
![]() Test Plan Assignee statistics on dashboard. In this example two Dimensional Stat. gadget shows matrix which tester has TP in given status.
Test Plan Assignee statistics on dashboard. In this example two Dimensional Stat. gadget shows matrix which tester has TP in given status.
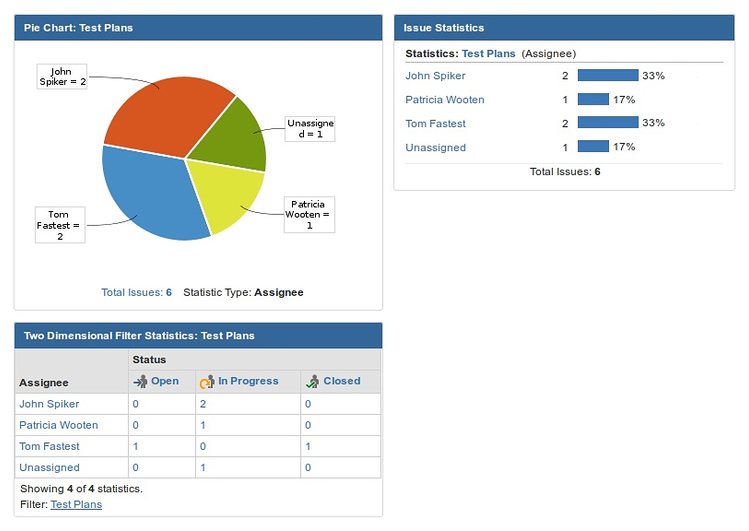
![]() You can make more similar statistics for:
You can make more similar statistics for:
- project
- versions
- labels
- status
- reporter
- assignee
- resolution
- component
- ...any statable custom field.
Test Case Statistics
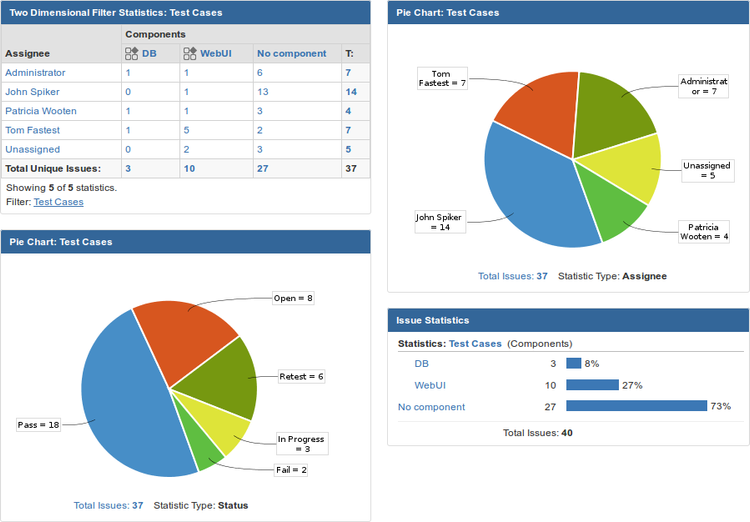
![]() If you need to show more detailed metrics based on Test Cases simply use 'Filter Result', 'Pie Chart', 'Two Dimensional Statistics', 'Issue Statistics' gadgets.
If you need to show more detailed metrics based on Test Cases simply use 'Filter Result', 'Pie Chart', 'Two Dimensional Statistics', 'Issue Statistics' gadgets.
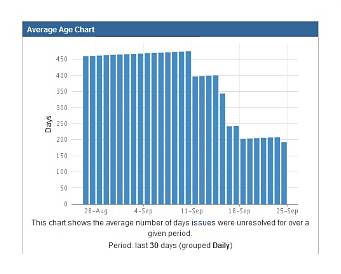
To show average TC resolution time choose 'Average Age' gadget:
Test Progress in Time
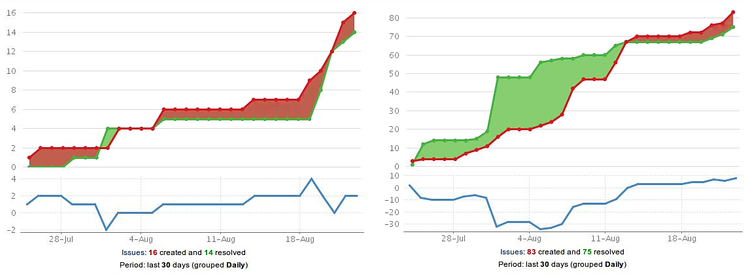
![]() Tracking TP progress is actually measuring TCs' resolution. With 'Created vs Resolved' gadget you can show how fast TCs are executed:
Tracking TP progress is actually measuring TCs' resolution. With 'Created vs Resolved' gadget you can show how fast TCs are executed: