This chapter is for advanced users/admins.
Diagnostic can be made on different levels. All levels are described in this chapter.

Diagnostic Levels
| Level | |
|---|---|
It relates to all configuration items in the plugin, such as (1) Connection, (2) Contract, Field Mapping Templates (from Adminstrator's Guide->Basic chapter). Pages in this section: Connection Diagnostic, Contract Diagnostic, Field Mapping Diagnostic | |
At this level you can diagnose data synchronization (issues, fields, comments, attachments). | |
Infrastructure can be more difficult to diagnose because of many external factors that can interfere with synchronization. That level refers to SSO, HTTP accelerators, proxies, etc. Unresolved problems from other levels may lead to infrastructure. |
Architecture
Deeper understanding of the plugin architecture may be helpful to resolve problems.
The plugin uses two queues to handle messages (IN, OUT). Each JIRA instance has these queues.
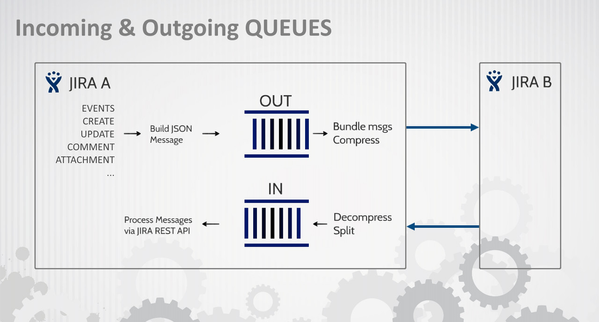
![]() Please, read below all marks carefully. This is quite low level introduction which understanding may be crucial to resolve some problems.
Please, read below all marks carefully. This is quite low level introduction which understanding may be crucial to resolve some problems.
- Message are stored in queues.
- Messages are flush after some period of time (see Services).
- There are several services and each service may have several tasks in sequence. For example OutgoingService do following:
- Process outgoing messages in NEW status (message types: Create, Update, Comment)
- Process outgoing messages in RETRY status (message types: Create, Update, Comment)
- Process outgoing messages in RETRY status (message types: Attachment)
- Process outgoing messages in NEW status (message types: Attachment)
- So you can image that single flush may not be able to process all data-synchronization at once.
- Each service can execute in different order each time (depending on cron and execution duration).
- Each service has some tasks that change message statuses which need to wait for next service execution to process further.
- Communication depends on execution from both JIRAs. Flushing local queues is not enough to make synchronization happen. They need to be flushed on remote JIRA too.
- You can make flush faster from Synchronization web panel on issue (described below).
- Messages (and services) have two main categories:
- Data (fields, comments, attachments)
- Confirmation / Response (only for acknowledge)
- Queues are in JIRA DB. You can browse them with right tool (SQLDeveloper, Heidi, MySQL Query Browser, etc.).
- Communication is made using HTTP protocol. You can sniff this communication with tools like HTTPNetworkSniffer.
- Changes on issues are in 90% made using JIRA REST API. However this API is called from local JIRA (not remote).
So this is internal HTTP communication. - There are different strategies to handle: create-update, comments, attachments. So HTTP messages may differ.
- Data format is JSON.
Preinstalled Components
During installation plugin create one custom field:
There is another custom field that can be setup manually:
Under the hood there are 7 services responsible for synchronization task:
- Outgoing Job - it is responsible for sending changes data to remote JIRA,
- Incoming Job - it is responsible for handling data receipt from remote JIRA,
- Outgoing Response Job - responsible for sending changes confirmation to JIRA which started data synchronization,
- Incoming Response Job - deals with incoming responses (mark data as synchronized),
- Archivization Job - move all synchronization data marked as done to archive,
- Pull Job - when JIRA is behind firewall(connection is in passive mode) and is not able to send synchronization data to remote instance, pull job in remote JIRA fetch data and performs synchronization,
- Pull Response Job - when JIRA is behind firewall(connection is in passive mode), this job in remote instance fetch all acknowledge information(it's similar to Outgoing Response Job, but works only when connection is in passive mode).
You can decide how often jobs run, to do that set whatever Cron expression you like in general configuration of the synchronizer.
See also Services
Synchronization Level
Synchronization | There is a web panel on issues that have a (2) Contract set. This panel can be disabled in general plugin configuration.
Panel sections:
Show Logs opens Log Browser in context of given issue (for more see Log Browser).
|
Log Browser | Log Browser is available in Administration -> Add-ons -> IssueSYNC -> Logs Browser
|
Log Files | JIRA has two folders with log files:
In the first one, the plugin creates intenso-synchronizer.log file with most of its logs. In case the file size will reach 20 MB intenso-synchronize.log.1 will be created. After a while old log files should be removed. Reading logs can be difficult because it contains error codes. For example: 2015-09-22 11:12:24|INFO |2|syn001|(SCHEDULED)| syn001 is a code that translates to "Archivization task was run!" (SCHEDULED) Complete codes list can be found in plugin jar (downloaded from marketplace or from your JIRA_HOME/plugins/installed_plugins directory) in file synchronizer-extended-logger.properties
|
Database | Queues can be browsed directly in database (use your favorite DB client):
There is also a log queue that contains more details about communication:
QueueIn Statuses:
QueueOut Statuses:
Few words about the sync flow
|
Disabled Contract | Contract can be disabled either one or both ways. Here are some rules that should apply SINCE V0.8.1
|


